In this blog post I will be presenting problems of SAS from a textbook written by Ron Cody.
The flow will be as such
To access data sets click here
PROBLEM 1 :
DATA DESCRIPTION;
We have a dataset named blood.txt. It contains id, name, bloodgroup, agegroup, wbc,rbc,chol.
CODE

PROBLEM 2;
Using the Bicycles data set, list all the observations for Road Bikes that cost more than $2,500 or Hybrids that cost more than $660. The variable Model contains the type of bike and UnitCost contains the cost
DATA DESCRIPTION
This program is executed using datalines, So the data will be in the program.
CODE
RESULT

LEARNING
In this program I have learned how to subset require information from data using "where" option
PROBLEM 3;
Run the program here to create a temporary SAS data set called Vitals:
data vitals;
input ID : #3. Age Pulse SBP DBP;
label SBP = "Systolic Blood Pressure"
DBP = "Diastolic Blood Pressure";
datalines;
001 23 68 120 80
002 55 72 188 96
003 78 82 200 100
004 18 58 110 70
005 43 52 120 82
006 37 74 150 98
007 . 82 140 100 ;
Using this data set, create a new data set (NewVitals) with the following new variables:
For subjects less than 50 years of age:
If Pulse is less than 70, set PulseGroup equal to Low;
otherwise, set PulseGroup equal to High.
If SBP is less than 130, set SBPGroup equal to Low;
otherwise, set SBPGroup equal to High.
For subjects greater than or equal to 50 years of age:
If Pulse is less than 74, set PulseGroup equal to Low;
otherwise, set PulseGroup equal to High.
If SBP is less than 140, set SBPGroup equal to Low;
otherwise, set SBPGroup equal to High.
assume there are no missing values for Pulse or SBP.
DATA DESCRIPTION
The data is given in the problem
CODE
RESULT

RESULT

LEARNING
I learnt how to sum and list observations
PROBLEM 5;
You have the following seven values for temperatures for each day of the week, starting with Monday: 70, 72, 74, 76, 77, 78, and 85. Create a temporary SAS data set (Temperatures) with a variable (Day) equal to Mon, Tue, Wed, Thu, Fri, Sat, and Sun and a variable called Temp equal to the listed temperature values. Use a DO loop to create the Day variable.
DATA DESCRIPTION
The data is in the program itself
CODE
RESULT

PROBLEM 6:
You invest $1,000 a year at 4.25% interest, compounded quarterly. How many years will it take to reach $30,000? Do not use compound interest formulas. Rather, use “brute force” methods with DO WHILE or DO UNTIL statements to solve this problem.
DATA DESCRIPTION
The data is in the problem statement
CODE
title "Listing of MONEY";
proc print data=money (obs=10);
run;
RESULT
To view as a image I have made observations to 10 but the result will be a bit longer than that

PROBLEM 7;
You have several lines of data, consisting of a subject number and two dates (date of birth and visit date). The subject starts in column 1 (and is 3 bytes long), the date of birth starts in column 4 and is in the form mm/dd/yyyy, and the visit date starts in column 14 and is in the form nnmmmyyyy (see sample lines below). Read the following lines of data to create a temporary SAS data set called Dates. Format both dates using the DATE9. format. Include the subject’s age at the time of the visit in this data set.
0011021195011Nov2006
0020102195525May2005
0031225200525Dec2006
DATA DESCRIPTION
The data is given in the program itself
CODE
RESULT

LEARNING
I learnt how to calculate the age difference between two dates
PROBLEM 8:
Using the SAS data set Blood, create two temporary SAS data sets called Subset_A and Subset_B. Include in both of these data sets a variable called Combined equal to .001 times WBC plus RBC. Subset_A should consist of observations from Blood where Gender is equal to Female and BloodType is equal to AB. Subset_B should consist of all observations from Blood where Gender is equal to Female, BloodType is equal to AB, and Combined is greater than or equal to 14.
DATA DESCRIPTION
The data set blood contains variables such as name, id , bloodgroup, agegroup, wbc, rbc, chol etc.
CODE
RESULT


LEARNING
In this program I learnt how to subset from a data set using where statement
PROBLEM 9;
Using the SAS data set Health, compute the body mass index (BMI) defined as the weight in kilograms divided by the height (in meters) squared. Create four other variables based on BMI: 1) BMIRound is the BMI rounded to the nearest integer, 2) BMITenth is the BMI rounded to the nearest tenth, 3) BMIGroup is the BMI rounded to the nearest 5, and 4) BMITrunc is the BMI with a fractional amount truncated. Conversion factors you will need are: 1 Kg equals 2.2 Lbs and 1 inch = .0254 meters.
DATA DESCRIPTION
The health data set consists of id, date of birth ,weight, height
CODE
RESULT

The data set blood contains variables such as name, id , bloodgroup, agegroup, wbc, rbc, chol etc.
CODE
RESULT

The flow will be as such
- Problem statement
- Data description
- Code
- Result
- Learning - what I have learnt from this problem
I am working on a permanent dataset with library name A15033
The link is below
libname A15033 "/folders/myfolders";
To access data sets click here
PROBLEM 1 :
Starting with the Blood data set, create a new, temporary SAS data set containing all the variables in Blood plus a new variable called CholGroup. Define this new variable as
CholGroup
Chol low low -110
medium 111 - 140
high 141 - high
Use a SELECT statement to do this.DATA DESCRIPTION;
We have a dataset named blood.txt. It contains id, name, bloodgroup, agegroup, wbc,rbc,chol.
CODE
libname A15033 "/folders/myfolders";
data A15033.blood;
infile "/folders/myfolders/blood.txt";
input id $ gender $ bloodgroup $ agegroup $ wbc rbc Chol;
select;
when (missing(Chol)) CholGroup = ' ';
when (Chol le 110) CholGroup = 'Low';
when (Chol le 140) CholGroup = 'Medium';
otherwise CholGroup = 'High';
end; run;
proc print data=A15033.blood (obs=10);
run;
RESULT
Click on the image to enlarge

LEARNING
In this program I learned about how to assign group names based on their characteristics and how to treat missing values.
PROBLEM 2;
Using the Bicycles data set, list all the observations for Road Bikes that cost more than $2,500 or Hybrids that cost more than $660. The variable Model contains the type of bike and UnitCost contains the cost
DATA DESCRIPTION
This program is executed using datalines, So the data will be in the program.
CODE
data bicycles;
input @1 country $15.
@16 model $15.
@31 purpose $11.
@42 quantity $6.
@48 price dollar11.;
datalines;
USA Road Bike Trek 5000 $2200
USA Road Bike Cannondale 2000 $2100
USA Mountain Bike Trek 6000 $1200
USA Mountain Bike Cannondale 4000 $2700
USA Hybrid Trek 4500 $650
France Road Bike Trek 3400 $2500
France Road Bike Cannondale 900 $3700
France Mountain Bike Trek 5600 $1300
France Mountain Bike Cannondale 800 $1899
France Hybrid Trek 1100 $540
United Kingdom Road Bike Trek 2444 $2100
United Kingdom Road Bike Cannondale 1200 $2123
United Kingdom Hybrid Trek 800 $490
United Kingdom Hybrid Cannondale 500 $880
United Kingdom Mountain Bike Trek 1211 $1121
Italy Hybrid Trek 700 $690
Italy Road Bike Trek 4500 $2890
Italy Mountain Bike Trek 3400 $1877
;
run;
title "Selected Observations from BICYCLES";
proc print data=bicycles noobs;
where model eq "Road Bike" and price gt 2500 or
model eq "Hybrid" and price gt 660;
run;
RESULT

LEARNING
In this program I have learned how to subset require information from data using "where" option
PROBLEM 3;
Run the program here to create a temporary SAS data set called Vitals:
data vitals;
input ID : #3. Age Pulse SBP DBP;
label SBP = "Systolic Blood Pressure"
DBP = "Diastolic Blood Pressure";
datalines;
001 23 68 120 80
002 55 72 188 96
003 78 82 200 100
004 18 58 110 70
005 43 52 120 82
006 37 74 150 98
007 . 82 140 100 ;
Using this data set, create a new data set (NewVitals) with the following new variables:
For subjects less than 50 years of age:
If Pulse is less than 70, set PulseGroup equal to Low;
otherwise, set PulseGroup equal to High.
If SBP is less than 130, set SBPGroup equal to Low;
otherwise, set SBPGroup equal to High.
For subjects greater than or equal to 50 years of age:
If Pulse is less than 74, set PulseGroup equal to Low;
otherwise, set PulseGroup equal to High.
If SBP is less than 140, set SBPGroup equal to Low;
otherwise, set SBPGroup equal to High.
assume there are no missing values for Pulse or SBP.
DATA DESCRIPTION
The data is given in the problem
CODE
data vitals;
input ID : $3. Age Pulse SBP DBP;
label SBP = "Systolic Blood Pressure"
DBP = "Diastolic Blood Pressure";
datalines;
001 23 68 120 80
002 55 72 188 96
003 78 82 200 100
004 18 58 110 70
005 43 52 120 82
006 37 74 150 98
007 . 82 140 100
;
run;
data newvitals;
set vitals;
if Age lt 50 and not missing(Age) then do;
if Pulse lt 70 then PulseGroup = 'Low ';
else PulseGroup = 'High';
if SBP lt 140 then SBPGroup = 'Low ';
else SBPGroup = 'High';
end;
else if Age ge 50 then do;
if Pulse lt 74 then PulseGroup = 'Low';
else PulseGroup = 'High';
if SBP lt 140 then SBPGroup = 'Low';
else SBPGroup = 'High';
end;
run;
title "Listing of NEWVITALS";
proc print data=newvitals noobs;
run;
RESULT
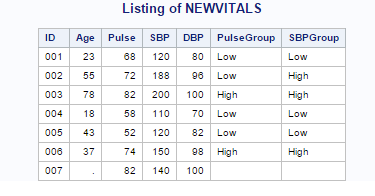
LEARNING
I have learned how to use nested if else statements along with do statement
PROBLEM 4:
Modify the program here so that each observation contains a subject number (Subj), starting with 1:
data test;
input Score1-Score3;
/* add your line(s) here */
datalines;
90 88 92
75 76 88
88 82 91
72 68 70
;
run;
DATA DESCRIPTION
The date is given is in the program itself
CODE
data test;
input Score1-Score3;
Subj + 1;
datalines;
90 88 92
75 76 88
88 82 91
72 68 70
;
run;
title "Listing of TEST";
proc print data=test noobs;
run;
input Score1-Score3;
Subj + 1;
datalines;
90 88 92
75 76 88
88 82 91
72 68 70
;
run;
title "Listing of TEST";
proc print data=test noobs;
run;
RESULT

LEARNING
I learnt how to sum and list observations
PROBLEM 5;
You have the following seven values for temperatures for each day of the week, starting with Monday: 70, 72, 74, 76, 77, 78, and 85. Create a temporary SAS data set (Temperatures) with a variable (Day) equal to Mon, Tue, Wed, Thu, Fri, Sat, and Sun and a variable called Temp equal to the listed temperature values. Use a DO loop to create the Day variable.
DATA DESCRIPTION
The data is in the program itself
CODE
data temperatures;
do Day = 'Mon','Tues','Wed','Thu','Fri','Sat','Sun';
input Temp @;
output;
end;
datalines;
70 72 74 76 77 78 85
;
run;
title "Listing of TEMPERATURES";
proc print data=temperatures noobs;
run;
do Day = 'Mon','Tues','Wed','Thu','Fri','Sat','Sun';
input Temp @;
output;
end;
datalines;
70 72 74 76 77 78 85
;
run;
title "Listing of TEMPERATURES";
proc print data=temperatures noobs;
run;
RESULT

LEARNING
I learnt how to assign days in chronological order using do loop
PROBLEM 6:
You invest $1,000 a year at 4.25% interest, compounded quarterly. How many years will it take to reach $30,000? Do not use compound interest formulas. Rather, use “brute force” methods with DO WHILE or DO UNTIL statements to solve this problem.
DATA DESCRIPTION
The data is in the problem statement
CODE
data money;
do Year = 1 to 999 until (Amount ge 30000);
Amount + 1000;
do Quarter = 1 to 4;
Amount + Amount*(.0425/4);
output;
end;
end;
format Amount dollar10.;
run;
do Year = 1 to 999 until (Amount ge 30000);
Amount + 1000;
do Quarter = 1 to 4;
Amount + Amount*(.0425/4);
output;
end;
end;
format Amount dollar10.;
run;
title "Listing of MONEY";
proc print data=money (obs=10);
run;
RESULT
To view as a image I have made observations to 10 but the result will be a bit longer than that
LEARNING
I have learned how to use DO WHILE and DO UNTIL statements to calculate compound interest
PROBLEM 7;
You have several lines of data, consisting of a subject number and two dates (date of birth and visit date). The subject starts in column 1 (and is 3 bytes long), the date of birth starts in column 4 and is in the form mm/dd/yyyy, and the visit date starts in column 14 and is in the form nnmmmyyyy (see sample lines below). Read the following lines of data to create a temporary SAS data set called Dates. Format both dates using the DATE9. format. Include the subject’s age at the time of the visit in this data set.
0011021195011Nov2006
0020102195525May2005
0031225200525Dec2006
DATA DESCRIPTION
The data is given in the program itself
CODE
data dates;
input @1 Subj $3.
@4 DOB mmddyy10.
@14 Visit date9.;
Age = yrdif(DOB,Visit,'Actual');
format DOB Visit date9.;
datalines;
00110/21/195011Nov2006
00201/02/195525May2005
00312/25/200525Dec2006
;
title "Listing of DATES";
proc print data=dates noobs;
run;
input @1 Subj $3.
@4 DOB mmddyy10.
@14 Visit date9.;
Age = yrdif(DOB,Visit,'Actual');
format DOB Visit date9.;
datalines;
00110/21/195011Nov2006
00201/02/195525May2005
00312/25/200525Dec2006
;
title "Listing of DATES";
proc print data=dates noobs;
run;
RESULT
LEARNING
I learnt how to calculate the age difference between two dates
PROBLEM 8:
Using the SAS data set Blood, create two temporary SAS data sets called Subset_A and Subset_B. Include in both of these data sets a variable called Combined equal to .001 times WBC plus RBC. Subset_A should consist of observations from Blood where Gender is equal to Female and BloodType is equal to AB. Subset_B should consist of all observations from Blood where Gender is equal to Female, BloodType is equal to AB, and Combined is greater than or equal to 14.
DATA DESCRIPTION
The data set blood contains variables such as name, id , bloodgroup, agegroup, wbc, rbc, chol etc.
CODE
data subset_a;
set mozart.blood;
where Gender eq 'Female' and bloodgroup='AB';
Combined = .001*WBC + RBC; run;
title "Listing of SUBSET_A";
proc print data=subset_a noobs;
run;
data subset_b;
set mozart.blood;
Combined = .001*WBC + RBC;
if Gender eq 'Female' and bloodgroup='AB' and Combined ge 14;
run;
title "Listing of SUBSET_B";
proc print data=subset_b noobs;
run;
set mozart.blood;
where Gender eq 'Female' and bloodgroup='AB';
Combined = .001*WBC + RBC; run;
title "Listing of SUBSET_A";
proc print data=subset_a noobs;
run;
data subset_b;
set mozart.blood;
Combined = .001*WBC + RBC;
if Gender eq 'Female' and bloodgroup='AB' and Combined ge 14;
run;
title "Listing of SUBSET_B";
proc print data=subset_b noobs;
run;
RESULT


LEARNING
In this program I learnt how to subset from a data set using where statement
PROBLEM 9;
Using the SAS data set Health, compute the body mass index (BMI) defined as the weight in kilograms divided by the height (in meters) squared. Create four other variables based on BMI: 1) BMIRound is the BMI rounded to the nearest integer, 2) BMITenth is the BMI rounded to the nearest tenth, 3) BMIGroup is the BMI rounded to the nearest 5, and 4) BMITrunc is the BMI with a fractional amount truncated. Conversion factors you will need are: 1 Kg equals 2.2 Lbs and 1 inch = .0254 meters.
DATA DESCRIPTION
The health data set consists of id, date of birth ,weight, height
CODE
libname A15033 "/folders/myfolders";
data A15033.health;
infile "/folders/myfolders/health.txt";
input @1 id $3.
@4 dob mmddyy10.
weight 14-16 height 17-18;
BMI = (Weight/2.2) / (Height*.0254)**2;
BMIRound = round(BMI);
BMIRound_tenth = round(BMI,.1);
BMIGroup = round(BMI,5);
BMITrunc = int(BMI);
run;
title "listing of health";
proc print;
format dob date9.;
run;
RESULT

LEARNING
In this program I learned how to round and truncate integers
PROBLEM 10;
List the first 10 observations in data set Blood. Include only the variables Subject, WBC (white blood cell), RBC (red blood cell), and Chol. Label the last three variables “White Blood Cells,” “Red Blood Cells,” and “Cholesterol,” respectively. Omit the Obs column, and place Subject in the first column. Be sure the column headings are the variable labels, not the variable names.
DATA DESCRIPTION
The data set blood contains variables such as name, id , bloodgroup, agegroup, wbc, rbc, chol etc.
CODE
data labelling;
set mozart.blood;
run;
title "First 10 Observations in BLOOD";
proc print data=mozart.blood(obs=10);
var id wbc rbc Chol;
label wbc = 'White Blood Cells'
rbc = 'Red Blood Cells'
Chol = 'Cholesterol';
run;
set mozart.blood;
run;
title "First 10 Observations in BLOOD";
proc print data=mozart.blood(obs=10);
var id wbc rbc Chol;
label wbc = 'White Blood Cells'
rbc = 'Red Blood Cells'
Chol = 'Cholesterol';
run;
RESULT

LEARNING
In this program I learned how to label variable and column names


