Pages

Saturday 19 December 2015

Hadoop with Hive - Baseball Problem

What is Hive?

Hive is a component of Hortonworks Data Platform(HDP). Hive provides a SQL-like interface to data stored in HDP.Hive provides a database query interface to Apache Hadoop.People often ask why do Pig and Hive exist when they seem to do much of the same thing. Hive because of its SQL like query language is often used as the interface to an Apache Hadoop based data warehouse. Hive is considered friendlier and more familiar to users who are used to using SQL for querying data. Pig fits in through its data flow strengths where it takes on the tasks of bringing data into Apache Hadoop and working with it to get it into the form for querying. A good overview of how this works is in Alan Gates posting on the Yahoo Developer blog titled Pig and Hive at Yahoo! From a technical point of view both Pig and Hive are feature complete so you can do tasks in either tool. However you will find one tool or the other will be preferred by the different groups that have to use Apache Hadoop. The good part is they have a choice and both tools work together.

Task

We are going to find the player with the highest runs for each year. This file has all the statistics from 1871–2011 and contains more that 90,000 rows. Once we have the highest runs we will extend the script to translate a player id field into the first and last names of the players.
The files downloading and uploading has already been done (refer previous program for process).

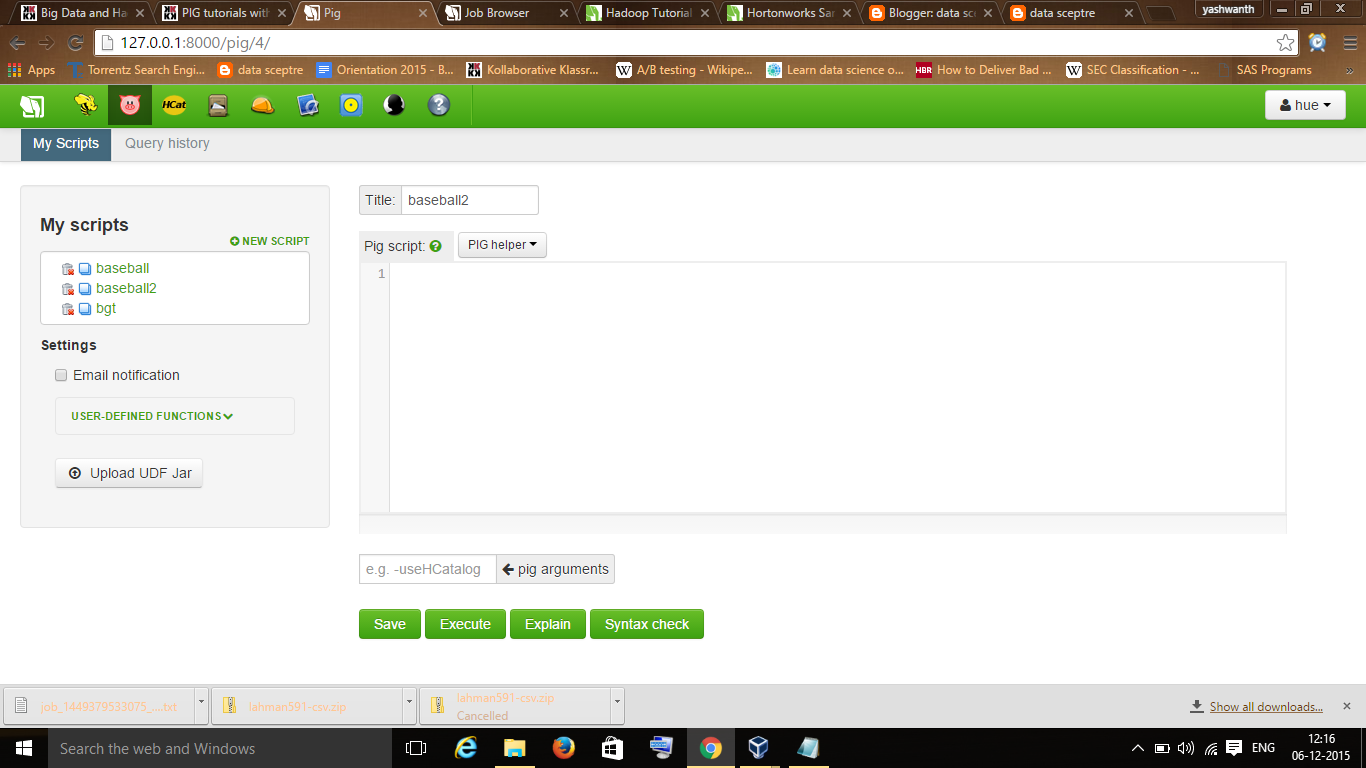
After starting hadoop environment we can go to the link    127.0.0.1:8000 which displays a web page as follows.(Click on the images to enlarge)


Then we can go to the file browser by clicking the icon in the header bar to see the files uploaded.

We can click on the second icon in the header bar to go to hive ui environment. We get directed to query editor where we can write, edit and execute code.( Note: In hive query editor we should execute one query at a time: for next query we should erase previous query and write a new one, not below it)

STEP 1: 

Create table called temp_batting
create table temp_batting (col_value STRING);


After writing query we should execute it by clicking execute in the footer. To check whether the table has been created click on the table in the second header bar.


To view table select table and click on the view icon as it is empty table we will not find any values.


STEP 2:

We load data into the hive environment by giving in path query as
LOAD DATA INPATH '/user/admin/Batting.csv' OVERWRITE INTO TABLE temp_batting;


STEP 3:

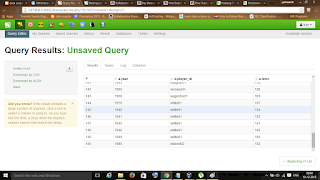
To view the data whether it is loaded properly we can use select command as 
SELECT * FROM temp_batting LIMIT 100;


It gives results as 

STEP 4:


We create another table batting with "player_id, year and runs"
create table batting (player_id STRING, year INT, runs INT);


We can view the table created by clicking view as we did previously


Then it takes sometimes to run the query


STEP 5:

Now we select year and max runs from table batting and group it by year
SELECT year, max(runs) FROM batting GROUP BY year;


It gives results as


We can scroll down and even to next page at the end of page

STEP 6:

To get names of players we use join as
SELECT a.year, a.player_id, a.runs from batting a
JOIN (SELECT year, max(runs) runs FROM batting GROUP BY year ) b
ON (a.year = b.year AND a.runs = b.runs) ;


The results will be


This makes end of program with desired results (pretty simple and interesting I guess :) ) 


Saturday 5 December 2015

Hadoop with Pig script - Program

What is Pig?


Pig is a high level scripting language that is used with Apache Hadoop. Pig excels at describing data analysis problems as data flows. Pig is complete in that you can do all the required data manipulations in Apache Hadoop with Pig. In addition through the User Defined Functions(UDF) facility in Pig you can have Pig invoke code in many languages like JRuby, Jython and Java. Conversely you can execute Pig scripts in other languages. The result is that you can use Pig as a component to build larger and more complex applications that tackle real business problems.

Pig scripts are translated into a series of MapReduce jobs that are run on the Apache Hadoop cluster. As part of the translation the Pig interpreter does perform optimizations to speed execution on Apache Hadoop. We are going to write a Pig script that will do our data analysis task.


Task

We are going to read in a baseball statistics file. We are going to compute the highest runs by a player for each year. This file has all the statistics from 1871–2011 and it contains over 90,000 rows. Once we have the highest runs we will extend the script to translate a player id field into the first and last names of the players.


We will download file from the following link


Once you have the file we will need to unzip the file into a directory. We will be uploading just the master.csv and batting.csv files.

click on the images to enlarge


After we start the virtual box we have to go to the link  http://127.0.0.1:8000/ , then we will see an GUI like the below image


As marked above we click on the file browser in the top left and upload csv files using upload button in the right corner.


After uploading we can see the files uploaded.

Now we move to the Pig script console by clicking pig image on the title bar which leads us to pig console where we can write, edit, save and execute pig commands.


Task

1. We need to load the data first. For that we use load statement.
batting = load 'Batting.csv' using PigStorage(',');
2. To filter out the first row of the data we add FILTER statement.
raw_runs = FILTER batting BY $1>0;
3. Now we name the fields, We will use FOREACH statement to iterate batting data object. We can use Pig helper to provide us with a template if required.So the FOREACH statement will iterate through the batting data object and GENERATE pulls out selected fields and assigns them names. The new data object we are creating is then named runs. 
runs = FOREACH raw_runs GENERATE $0 as playerID, $1 as year, $8 as runs;
4. We will use GROUP statement to group the elements in runs by the year field.
grp_data = GROUP runs by (year);
5. We will use FOREACH statement to find the maximum runs for each year.
max_runs = FOREACH grp_data GENERATE group as grp,MAX(runs.runs) as max_runs;
6. We use the maximum runs we need to join this with the runs data object so we can pick up the     player.
join_max_run = JOIN max_runs by ($0, max_runs), runs by (year,runs);
7. The result will be a dataset with "Year, PlayerID and Max Run".
join_data = FOREACH join_max_run GENERATE $0 as year, $2 as playerID, $1 as runs;
8. At the end we DUMP data to the output.
DUMP join_data;


Then we will save the program and execute it.


We can check in the job browser the progress of the job initiated.     


After completion of the job we can see it is succeded.


 In the pig script in the query history we can see the results and log.
                                                 
                                   
 We can see the results as we mentioned in the code as "Year", "Player_id", and "Max_run".

                                     
Scroll the results to view all years.


We should always check the log to see if the script was executed correctly.


We can download the results as txt file for further reference.

Saturday 21 November 2015

Hadoop - WordCount Program

This post describes step by step instructions on how to run WordCount program in Hadoop using Hortonworks virtual box. The prerequisites are virtual box application and sandbox_hdp_2.3_1 in the form of ova image which was explained in the other post in detail.

STEP 1

Open Oracle VM VirtualBox Manager and allocate a minimum of 4gb for hadoop in the settings. Then start the process by clicking start which is indicated by a green arrow mark.

click on the image to enlarge


STEP 2

After the virtual box has been started a console pop up and the processes for setting up hadoop in the machine continues for nearly 2 minutes.
                                                           
                                                            click on the image to enlarge


After you can see the above image which indicates the hadoop has been set up on your machine, press if it is a windows machine, which gives you username and password to login to shell script

                                                       click on the image to enlarge


STEP 3

To view hortonworks GUI you have to go to this link http://127.0.0.1:8888/  

                                                       click on the image to enlarge


To begin with shell script you have to go to this link http://127.0.0.1:4200/

                                                     click on the image to enlarge


STEP 4

So as the shell script appears you have to login with username: root and password : hadoop
Note : it may be sometimes the password you type is not visible but it works.
Then you have to make a directory with command mkdir

mkdir WCclasses


The first java files should be opened in any text editor and the codes should be copied
Then you have to upload the java programming files in the text editor with command


vi WordCount.java


click on the image to enlarge


You have to right click on the shell script and use option of paste from browser to paste the code. Then cross check whether the code has been pasted as such or any missing letters probably in the beginning of the code. Then press esc and use (:w) to save and (:q) to quit. And you are back from text editor.

                                                         click on the image to enlarge


You have to follow same procedure for the other two files one by one( use vi WordMapper.java and SumResucer.java, then paste the codes copied and save and then quit).

STEP 5

After uploading all the java programming files now you have to compile by using the following codes one by one
javac -classpath /usr/hdp/2.3.0.0-2557/hadoop/hadoop-common-2.7.1.2.3.0.0-2557.jar:/usr/hdp/2.3.0.0-2557/hadoop-mapreduce/hadoop-mapreduce-client-core-2.7.1.2.3.0.0-2557.jar:/usr/hdp/2.3.0.0-2557/hadoop-mapreduce/commons-cli-1.2.jar: -d WCclasses WordCount.java

javac -classpath /usr/hdp/2.3.0.0-2557/hadoop/hadoop-common-2.7.1.2.3.0.0-2557.jar:/usr/hdp/2.3.0.0-2557/hadoop-mapreduce/hadoop-mapreduce-client-core-2.7.1.2.3.0.0-2557.jar:/usr/hdp/2.3.0.0-2557/hadoop-mapreduce/commons-cli-1.2.jar -d WCclasses WordMapper.java

 javac -classpath /usr/hdp/2.3.0.0-2557/hadoop/hadoop-common-2.7.1.2.3.0.0-2557.jar:/usr/hdp/2.3.0.0-2557/hadoop-mapreduce/hadoop-mapreduce-client-core-2.7.1.2.3.0.0-2557.jar:/usr/hdp/2.3.0.0-2557/hadoop-mapreduce/commons-cli-1.2.jar -d WCclasses SumReducer.java

If you do not get any message and the underscore moves to next line it means that the code is good and it is compiled. If it gives any message then code should be properly checked before pasting and after pasting.

STEP 6

Once you are done with compilation, you should use jar command to give a jar file.


jar -cvf WordCount.jar -C WCclasses/ .

It should give the similar output
                 
                                                        click on the image to enlarge


Now you should use the output command to yield the output
                                         

hadoop jar WordCount.jar WordCount /user/hue/wc-inp /user/hue/wc-out6


the number out6 indicates number of times the output has been produced so i'm using 6 because I have runned the output 5 times previously, you can use starting with out1 if it is first time.

The output should be similar. In the end it should "the url to track the job". If it appears that means it is successfully submitted and our work with shell script has been completed. Now its time to move to eye candy GUI part.

STEP 7


Let the console be like that and go to the link  http://127.0.0.1:8088/cluster to view the ongoing process. And after it has been completed(keep on refreshing) go to the link http://127.0.0.1:8000/about/  and in the icons click on the file browser which should lead you to window like this
                                              
                                                        click on the image to enlarge


Then click on the output you have given and click on the "part r-00000" to view output.
                                                     
                                                      click on the images to enlarge


The presented above is the output showing each word count (frequency) in the books.

Friday 2 October 2015

SAS Problems - 2

In this blog post I will be presenting problems of  SAS from a textbook written by Ron Cody.
The flow will be as such
         
  • Chapter
  • Problem statement
  • Code
  • Result
  • Learning - what I have learnt from this problem


CHAPTER: 16

PROC MEANS (or PROC SUMMARY) primarily as a way to generate summary reports, reporting the sums and means of your numeric variables. However, these procedures are much more versatile and can be used to create summary data sets that can then be analysed with more DATA or PROC steps.


PROBLEM 1:


 Using the SAS data set College, compute the mean, median, minimum, and maximum and the number of both missing and non-missing values for the variables ClassRank and GPA. Report the statistics to two decimal places. 


CODE : 


libname A15033 "/folders/myfolders";
options fmtsearch=(A15033);

 title "Statistics on the College Data Set";
 proc means data=A15033.college
                    n
                    nmiss
                    mean
                    median
                    min
                    max
                    maxdec=2;
 
 var ClassRank GPA;
 run;
RESULT


LEARNING :
I had an understanding of how Proc means, n , nmiss , maxdec work.  


CHAPTER 17;

PROC FREQ can be used to count frequencies of both character and numeric variables, in one-way, two-way, and three-way tables. In addition, you can use PROC FREQ to create output data sets containing counts and percentages.

PROBLEM 2 :

Using the SAS data set Blood, generate one-way frequencies for the variables Gender, BloodType, and AgeGroup. Use the appropriate options to omit the cumulative statistics and percentages.


CODE

title "frequencies from blood data set";
proc freq data=A15033.blood;
tables Gender BloodGroup Age/ nocum nopercent;
run;


RESULT :


LEARNING :

I had an understanding of how Proc Freq


CHAPTER 17


PROC FREQ can be used to count frequencies of both character and numeric variables, in one-way, two-way, and three-way tables. In addition, you can use PROC FREQ to create output data sets containing counts and percentages.

PROBLEM  3;

Using the SAS data set Blood, generate one-way frequencies for the variables Gender, BloodType, and AgeGroup. Use the appropriate options to omit the cumulative statistics and percentages.


CODE :


title "Creating a 3 way table for college";
proc freq data=A15033.college;
tables Gender * Scholarship * SchoolSize/ nocol norow nopercent;
run;


RESULT :


LEARNING


I had an understanding of how proc freq works


CHAPTER 18

PROC TABULATE is an underused, under-appreciated procedure that can create a wide variety of tabular reports, displaying frequencies, percentages, and descriptive statistics (such as sums and means) broken down by one or more CLASS variables.


PROBLEM 4:

Using the SAS data set College, write the appropriate PROC TABULATE statements to produce the given table.

CODE :

title "College Demography";
proc tabulate data=A15033.college;
class Gender Scholarship SchoolSize;
tables Gender Scholarship All;
Schoolsize/rts=15;
keylabel n=" ";
 run;
RESULT


LEARNING

I had an understanding of how to use PROC Tabulate for table forming using "Class", "Tables"  and "Keylabel" statement.


CHAPTER 19;
The Output Delivery System, abbreviated as ODS.  The outputs were difficult to incorporate into other documents, such as Microsoft Office Word or Microsoft Office PowerPoint. Hence this ODS brought about a revolution by actually allowing SAS enthusiasts to save the outputs in the desired format.

PROBLEM 5;
Using the SAS data set Test Score, write the appropriate ODS output path along with PROC PRINT to produce the required output.


CODE :


ods html file ="/folders/myfolders/ODS_Outputs/prog1.html";

title "Test Score Listings";
proc print data=A15033.Test_Scores;
id ID; var Score1-Score3;
run;
proc means data=A15033.Test_Scores n max min mean median maxdec=1;
var Score1-Score3;
run;
RESULT


The usage of  'ODS Html file' for stating the output path and generating an html output


LEARNING

I had an understanding of how to use Proc Print with ODS.